9 Jun 08 Monday - Pre-market Trade Thoughts (put heading ok, better comply with instructions....by the warlords of this forum)
Going into Monday...after a gigantic selloff of all indexes last Fri, we must tread cautiously... in particular, the fact that there seemed to be
no short covering towards the end of Fri, spells danger for Shorts. I repeat my boring stuff...nothing drops without a bounce, unless it is mucus...even so, there is bounce, except it is at the molecular level, and so, not visible to the naked eye, unless we employ a microscope.
nevertheless, i repost this picture, so that the fact is drilled in.... the Diarrhea portion to be given specific attention; ie past 2am Fri index movement... the fact that a "relieve bounce"
could possibly happen on Monday....or perhaps a sideways consolidation of sorts...(who knows for sure...)

I like to highlight a few key developments on going at this juncture (635pm singapore time)
a) Oil is showing signs of weakness and was reported this afternoon that hedge funds are selling into Oil high price
b) eur/usd is seen as reaching recent top; Monday's intraday high of 1.5842 (historical high being at ~1.6)
finally some commentaries for those of us, preparing our mentalselves for the battle ahead...
"all hands, battle station"************
"With the S&P 500 in 'no man's land,' the
Dow still below major resistance levels, and the
Nasdaq trying to break out to a new intermediate-term high, the major indices are obviously out of sync with one another. Whenever this occurs, trading typically becomes
whippy and indecisive." The subsequent action that followed that day certainly proved our expectation of indecision!
Last Thursday, stocks gapped higher on the open, then built on their gains throughout the session, but the exact opposite scenario occurred on Friday. Instead, the broad market opened lower, then continued trending down throughout until the closing bell. When the dust settled, the major indices had followed up Thursday's impressive average gains of 2% by plunging approximately 3% on Friday.
The S&P 500 and Dow Jones Industrial Average suffered identical losses of 3.1%, as the Nasdaq Composite tumbled 3.0%. Even the small-cap Russell 2000, which had been showing relative strength to the broad market, fell 3.0%. The S&P Midcap 400 lost "only" 2.6%. Inverse of the previous day's closing action, all the main stock market indexes finished at their intraday lows.
Total volume in the NYSE surged 17% above the prior day's level, causing the S&P 500 to register a
bearish "distribution day." Trading in the NYSE rose to its highest level since April 1 of this year, but that's obviously negative considering the higher turnover correlated with massive losses.
Institutional selling in the Nasdaq, however, was less prevalent. Turnover in the tech-heavy Nasdaq eased 1%. Nevertheless, market internals were atrocious across the board. In the NYSE, declining volume crushed advancing volume by a margin of nearly
12 to 1. The Nasdaq adv/dec volume ratio was negative by approximately
9 to 1.
The S&P 500 finally joined the Dow Jones Industrials by making a "lower low" on its daily chart. This occurred when last Friday's sell-off shoved the S&P below support of its prior lows from May.
In a much more precarious position, the
Dow Jones Industrial Average slid to new lows within its intermediate-term downtrend. Showing relative weakness within the stock market, recall that the Dow had already broken down below its May lows several days ahead of the S&P 500. Perhaps most concerning about the Dow is that last Friday's pounding caused the index to lose support of its 61.8% Fibonacci retracement from the March 2008 low to May 2008 high.
In uptrends, a pullback to the 61.8% retracement level is typically considered the "last line of defense" that prevents a complete reversal back to the lows. Unless the Dow suddenly roars back today, odds are now good the index will soon lead the rest of the main stock market indexes in testing its 52-week low.
The break of the 61.8% Fibonacci retracement on the Dow's daily chart is
super bad news for bulls. Also, note the double top that caused the Dow to instantly reverse after running into its 200-day MA twice last month. (you'll need to go back to my earlier post on Sat morning at 530am) to see the technicals.
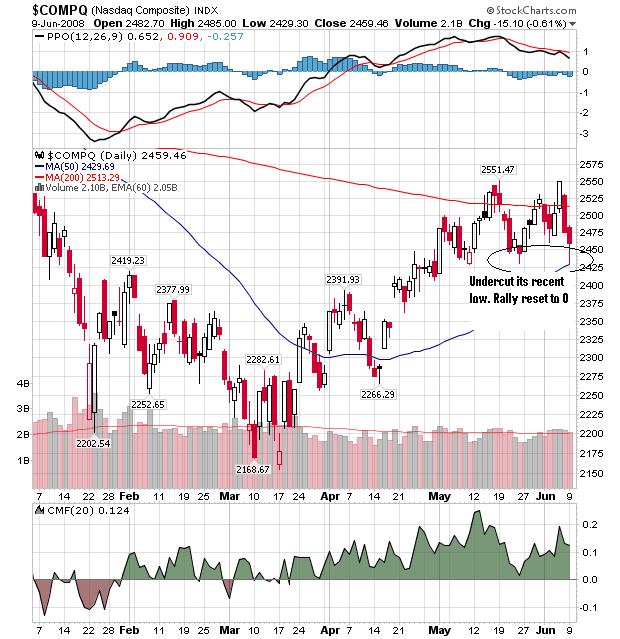
The Nasdaq Composite, which closed at a new five-month high just two days ago, has already fallen back below both its 20 and 200-day moving averages. It also closed just a tad below its three-month uptrend line, but not by a wide enough margin to declare a clean break of trendline support.
Still, despite last Friday's nasty reversal, the Nasdaq continues to show relative strength and a much stronger chart pattern than both the S&P and Dow. Specifically, it's still well above its 50-day MA, as well as its prior lows from last month. If the stock market dazzles us with another whipsaw move back up, the Nasdaq is still the place to be.
Last Friday's sell-off means the
broad market trends are now "down" for all three timeframes: near-term, intermediate-term, and long-term. A pattern of "lower highs" and "lower highs" is now prevalent in each of those timeframes, though the Nasdaq the near and intermediate-term trends of the Nasdaq might be the exception. In the big picture, don't forget that stocks have been in a primary downtrend since last October. We must therefore assume the recent March through May rally was merely a counter-trend bounce from "oversold" conditions.
Keep those stops in place and remember to
trade what you see, not what you think!*******
with this in mind....i wish you all HUat HUat in the coming week.... let's the games begin (oh well, in 2.45hrs time)