US - Market Direction 01 (May 08 - Jul 08)

Re: US - Market Direction

Postby kennynah » Wed May 28, 2008 5:47 am

Oil Dropped off and settled at about $129.40

Spot Gold lost some $20 to close at about $906

DOW gained 68pts 12,548
SP500 gained 9pts 1,385
Naz gained 36pts 2,481


I've decided to show NYSE Composite chart

Please note the pattern circled in RED

Image


also, it's been a while since i put up a VIX chart....this is how it looks

a) it has returned to Apr30's level
b) just be aware that it's reaching the edge of the Upper Bollinger Band (and hence a tendency to reverse)
c) note that it started at the high end of the bar and closed down at the bottom of the bar

Image
Options Strategies & Discussions .(Trading Discipline : The Science of Constantly Acting on Knowledge Consistently - kennynah).Investment Strategies & Ideas

Image..................................................................<A fool gives full vent to his anger, but a wise man keeps himself under control-Proverbs 29:11>.................................................................Image
User avatar
kennynah
Lord of the Lew Lian
 
Posts: 14201
Joined: Wed May 07, 2008 2:00 am
Location: everywhere.. and nowhere..

Re: US - Market Direction

Postby millionairemind » Thu May 29, 2008 3:29 pm

Just a quick note.. The NYSE short interest ratio continues to edge up, and it is not letting up...

It currently stands at 14.26 and is the highest in 5 years. A lot of bears are out there.. just waiting.....

Lets see who wins this round.. :)
"If a speculator is correct half of the time, he is hitting a good average. Even being right 3 or 4 times out of 10 should yield a person a fortune if he has the sense to cut his losses quickly on the ventures where he has been wrong" - Bernard Baruch

Disclaimer - The author may at times own some of the stocks mentioned in this forum. All discussions are NOT to be construed as buy/sell recommendations. Readers are advised to do their own research and analysis.
User avatar
millionairemind
Big Boss
 
Posts: 7776
Joined: Wed May 07, 2008 8:50 am
Location: The Matrix

Re: US - Market Direction

Postby winston » Thu May 29, 2008 4:49 pm

Pros:-
1) VIX is higher, meaning that there is a "reduction in complacency". Still complacent though..
2) Shorts interest are high, a contrarian indicator. But people are continuing to short.
3) Plenty of cash on sideline
4) If oil tanks, it would be a good catalyst for the market to go up

Cons:-
1) Still plenty of bad news out there
2) Continuation of Profit-taking
3) If oil goes up again, market will tank
4) Continuation of Short-Selling
It's all about "how much you made when you were right" & "how little you lost when you were wrong"
User avatar
winston
Billionaire Boss
 
Posts: 112728
Joined: Wed May 07, 2008 9:28 am

Re: US - Market Direction

Postby kennynah » Thu May 29, 2008 4:49 pm

a summary of how the indexes ddi last night...

it is important to note that for most parts of the trading day, all indexes were under water.

at the start of trading day, indexes were +ve, mainly due to a sharp decline in Oil prices. However, as soon as Oil prices rebounded to 131 levels, all major indexes reversed and stayed in -ve territories.

it was until at about after lunch hour, that indexes began rallying and closed as there are :

28may08 Indexes
Image

important to note that almost all these indexes saw higher volume transacted compared to previous day.

Given VIX is in "overbought" territory (judging from Bollinger Band), it maybe experiencing resistance.

Finally, GDP revision figures will be released on 29May, 830pm singapore time .. widely believed to be adjusted upwards from 0.6% to 0.9%....if this number is better than epected, then Shorts must be very careful in the short term.

Oil traders (and related metals, stocks), should also note that Oil Inventory will be released tonight as well. Inventory is expected have been drawn down last week. This report is a shaker of Oil price.
Options Strategies & Discussions .(Trading Discipline : The Science of Constantly Acting on Knowledge Consistently - kennynah).Investment Strategies & Ideas

Image..................................................................<A fool gives full vent to his anger, but a wise man keeps himself under control-Proverbs 29:11>.................................................................Image
User avatar
kennynah
Lord of the Lew Lian
 
Posts: 14201
Joined: Wed May 07, 2008 2:00 am
Location: everywhere.. and nowhere..

Re: US - Market Direction

Postby winston » Fri May 30, 2008 9:17 am

I expected Oil to drop. It dropped but the $4 move downwards did not really push the market upwards. This tells me that the market is quite weak.

And tomorrow is Friday, a generally weak day.

What do you all think ?
It's all about "how much you made when you were right" & "how little you lost when you were wrong"
User avatar
winston
Billionaire Boss
 
Posts: 112728
Joined: Wed May 07, 2008 9:28 am

Re: US - Market Direction

Postby millionairemind » Fri May 30, 2008 9:42 am

W,

AH DOW touched 50DMA and retreated. Nasdaq touched 200DMA and retreated.

The high oil that caused the correction starting last Wed did not persist... one less factor pressing down the mkt.

First time I have seen mkt attempt to rebound within a week of correction... but then, who am I to predict? Just follow its lead.

Last night is Day 3 of Rally attempt. I still have my shorts going forward but will close out if I don't see a market break tonight. The volume on Nasdaq (the leading index) has been increasing each successive day, but lower than average.

If mkt does follow thro', I just flip my shorts to longs.. :)

Cheers,
mm
"If a speculator is correct half of the time, he is hitting a good average. Even being right 3 or 4 times out of 10 should yield a person a fortune if he has the sense to cut his losses quickly on the ventures where he has been wrong" - Bernard Baruch

Disclaimer - The author may at times own some of the stocks mentioned in this forum. All discussions are NOT to be construed as buy/sell recommendations. Readers are advised to do their own research and analysis.
User avatar
millionairemind
Big Boss
 
Posts: 7776
Joined: Wed May 07, 2008 8:50 am
Location: The Matrix

Re: US - Market Direction

Postby blid2def » Fri May 30, 2008 9:48 am

I just don't really know I can believe the oil - equities inverse correlation that the journalists and analysts seem to want to sell us. I look back at the rally from March - equities indexes have been marching up in tandem with crude prices. Crude dips along the way did give the indexes an instant kick-up, but crude recoveries and upwards movement after those dips didn't slow indexes down in the northwards march up until last week.

If you go further back - oil movements in Jan - Feb this year mirrored equities movements when all went south (granted there were other factors in play then, i.e. 'sub-prime / credit liquidity issues').

Conclusion - I dunno WTF is going on too. :D
blid2def
Permanent Loafer
 
Posts: 2304
Joined: Tue May 06, 2008 7:03 pm

Re: US - Market Direction

Postby learn2win » Fri May 30, 2008 11:45 am

WTF market is doing means volatility persists. For trend trader like me or MM, i do think it is best to avoid the current market. If the itchiness do not go off, it will be better to buy at extreme support or shorting at extreme resistance. :lol:

With the soccer season starting in a week's time, I think it is better to enjoy the balls. :P
Guard Thy Treasure from Losses - The Fourth Cure for a Lean Purse - George Clason
User avatar
learn2win
Coolie
 
Posts: 151
Joined: Wed May 14, 2008 3:30 pm

Re: US - Market Direction

Postby kennynah » Fri May 30, 2008 7:35 pm

30may - Before Market Notes...

Stocks scored their third straight session of gains since recovering from last week's sell-off, but several key resistance levels caused the major indices to surrender nearly half of the day's gains in the late afternoon.

After trending higher throughout most of the day, then pulling back in the final ninety minutes, the Nasdaq Composite gained 0.9%, the S&P 500 0.5%, and the Dow Jones Industrial Average 0.4%. The small-cap Russell 2000 again showed a bit of relative strength by climbing 1.0%, but the S&P Midcap 400 lagged behind by closing just 0.3% higher. All the main stock market indexes finished near the middle of their intraday ranges, essentially putting the bulls and bears on parity into the close.

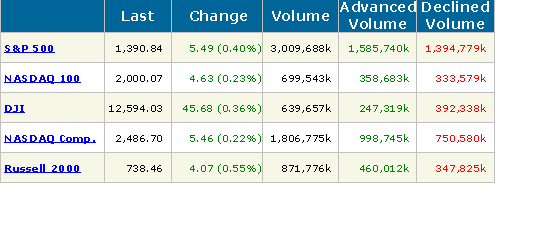
Turnover crept higher across the board. Total volume in the NYSE was 3% greater than the prior day's level, while volume in the Nasdaq picked up 6%. Although it was the second day of increased trading activity in the broad market, volume in both exchanges remained below average levels for the fifth straight day.

As with the previous day's session, stocks again climbed on mediocre market internals. Advancing volume in the NYSE exceeded declining volume by a margin of only 3 to 2. The Nasdaq adv/dec volume ratio was positive by just over 2 to 1.

The numerous oil-related ETFs, the sector flashed some very important warning signs yesterday that a top may be forming in the near future. Which is demonstrated on the chart of the U.S. Oil Fund (USO), an ETF proxy that roughly follows the price of crude.

After opening 1.4% lower than the previous day's close, USO quickly reversed its opening weakness and rocketed higher as the government said crude inventory had dropped to its lowest levels since 2004 during its 10:30 am ET weekly report of crude oil reserves.

This bullish news for crude oil should have had an overly positive effect on its price action throughout the rest of the day. Instead, however, traders aggressively sold into strength of the knee-jerk reaction, causing crude to drop back down to its opening level just one hour later.

The heavy selling continued into the afternoon, eventually leading both the crude oil commodity and USO to close the session with a 3.4% loss. When a steadily uptrending stock or commodity drops sharply in the face of positive news, as crude oil did yesterday, it is often a warning sign of exhaustion.

Conversely, it's typically a bullish sign when traders ignore negative market news and send a stock or commodity higher regardless of bad news. Next, take a look at the daily chart of USO:


Image

The overly negative reaction to yesterday's crude inventory report caused USO to close below its previous day's low, forming a bearish "shooting star" candlestick pattern in the process.

Since USO rallied sharply and closed near its intraday high on Wednesday, yesterday's swift reversal to break Wednesday's low had the effect of trapping the bulls who just bought the short-term pullback from last week's highs.

As such, those trapped bulls were forced to quickly liquidate their positions yesterday, which led to a large volume spike in both USO and the actual crude oil futures contracts. Looking at the daily chart above, note that yesterday's single day volume of nearly 22 million shares was the highest USO has experienced since the ETF began trading more than two years ago!

When record turnover corresponds with a heavy percentage loss near the top of an extended uptrend, it is a legitimate warning sign of possible exhaustion
. Remember volume is the one technical indicator that never lies, and is also a leading, rather than lagging, indicator.

Astute traders who know the extreme importance of closely monitoring volume patterns will certainly not ignore yesterday's USO volume surge.


If you are looking to Short USO, but uncomfortable being naked, then consider buying DUG; UltraShort Oil & Gas ProShares ((this is not any form of recommendation to act))


Yesterday's late-day sell-off in the broad market occurred as several of the main stock market indexes ran into significant levels of technical resistance. The Nasdaq Composite, the only one of the "big 3" major indices still holding above its intermediate-term uptrend line, stalled after probing a few points above pivotal resistance of its 200-day moving average. Worse, the index is still in the precarious position of forming the right shoulder of a bearish "head and shoulders" pattern

Image


The weakest of the "big 3" broad- based indexes, the Dow Jones Industrial Average reversed after running into resistance of its 50-day MA and coming within a few points of its 20-day EMA. After the Dow broke below support of its 50-day MA on May 21, that key moving average became the new resistance level. As such, it's not surprising that the Dow ran stops above the 50-day MA, but failed to actually close above it.


Image
Options Strategies & Discussions .(Trading Discipline : The Science of Constantly Acting on Knowledge Consistently - kennynah).Investment Strategies & Ideas

Image..................................................................<A fool gives full vent to his anger, but a wise man keeps himself under control-Proverbs 29:11>.................................................................Image
User avatar
kennynah
Lord of the Lew Lian
 
Posts: 14201
Joined: Wed May 07, 2008 2:00 am
Location: everywhere.. and nowhere..

Re: US - Market Direction

Postby millionairemind » Sat May 31, 2008 3:37 pm

As of Friday, the total NYSE SHORT INTEREST RATIO has climbed even higher.

It now stands at 14.30, a five year high (keeps pushing the boundaries). This is the first I have seen it so high. To put it in perspective, in the big January 08 MAULING, it was only at 10.

Some body is hurting big time... and applying BURNT HAND LOSE MONEY CREAM. (that includes me
:mrgreen: )

Last night is DAY 4 of Rally attempt.. the Nasdaq index is still struggling to push ahead.

Lets see who wins BIG this round.
"If a speculator is correct half of the time, he is hitting a good average. Even being right 3 or 4 times out of 10 should yield a person a fortune if he has the sense to cut his losses quickly on the ventures where he has been wrong" - Bernard Baruch

Disclaimer - The author may at times own some of the stocks mentioned in this forum. All discussions are NOT to be construed as buy/sell recommendations. Readers are advised to do their own research and analysis.
User avatar
millionairemind
Big Boss
 
Posts: 7776
Joined: Wed May 07, 2008 8:50 am
Location: The Matrix

PreviousNext

Return to Archives

Who is online

Users browsing this forum: No registered users and 2 guests