30may - Before Market Notes...
Stocks scored their third straight session of gains since recovering from last week's sell-off, but
several key resistance levels caused the major indices to surrender nearly half of the day's gains in the late afternoon.
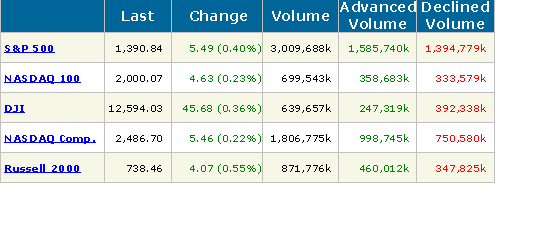
After trending higher throughout most of the day, then pulling back in the final ninety minutes, the Nasdaq Composite gained 0.9%, the S&P 500 0.5%, and the Dow Jones Industrial Average 0.4%. The small-cap Russell 2000 again showed a bit of relative strength by climbing 1.0%, but the S&P Midcap 400 lagged behind by closing just 0.3% higher.
All the main stock market indexes finished near the middle of their intraday ranges, essentially putting the bulls and bears on parity into the close.
Turnover crept higher across the board.
Total volume in the NYSE was 3% greater than the prior day's level, while volume in the Nasdaq picked up 6%. Although it was the second day of increased trading activity in the broad market,
volume in both exchanges remained below average levels for the fifth straight day.
As with the previous day's session, stocks again climbed on mediocre market internals.
Advancing volume in the NYSE exceeded declining volume by a margin of only 3 to 2. The Nasdaq adv/dec volume ratio was positive by just over 2 to 1.
The numerous
oil-related ETFs, the sector flashed some very important warning signs yesterday that a top may be forming in the near future. Which is demonstrated on the chart of the U.S. Oil Fund (USO), an ETF proxy that roughly follows the price of crude.
After opening 1.4% lower than the previous day's close,
USO quickly reversed its opening weakness and rocketed higher as the government said crude inventory had dropped to its lowest levels since 2004 during its 10:30 am ET weekly report of crude oil reserves.
This bullish news for crude oil should have had an overly positive effect on its price action throughout the rest of the day. Instead, however, traders aggressively sold into strength of the knee-jerk reaction, causing crude to drop back down to its opening level just one hour later.
The heavy selling continued into the afternoon,
eventually leading both the crude oil commodity and USO to close the session with a 3.4% loss.
When a steadily uptrending stock or commodity drops sharply in the face of positive news, as crude oil did yesterday, it is often a warning sign of exhaustion.
Conversely, it's typically a bullish sign when traders ignore negative market news and send a stock or commodity higher regardless of bad news. Next, take a look at the daily chart of USO:
 The overly negative reaction to yesterday's crude inventory report caused USO to close below its previous day's low, forming a bearish "shooting star" candlestick pattern in the process.
Since USO rallied sharply and closed near its intraday high on Wednesday, yesterday's swift reversal to break Wednesday's low had the effect of trapping the bulls who just bought the short-term pullback from last week's highs.
As such, those trapped bulls were forced to quickly liquidate their positions yesterday, which led to a large volume spike in both USO and the actual crude oil futures contracts. Looking at the daily chart above, note that yesterday's single day volume of nearly 22 million shares was the highest USO has experienced since the ETF began trading more than two years ago!
When record turnover corresponds with a heavy percentage loss near the top of an extended uptrend, it is a legitimate warning sign of possible exhaustion. Remember volume is the one technical indicator that never lies, and is also a leading, rather than lagging, indicator.
Astute traders who know the extreme importance of closely monitoring volume patterns will certainly not ignore yesterday's USO volume surge.If you are looking to Short USO, but uncomfortable being naked, then consider buying DUG; UltraShort Oil & Gas ProShares ((this is not any form of recommendation to act))
Yesterday's late-day sell-off in the broad market occurred as several of the main stock market indexes ran into significant levels of technical resistance.
The Nasdaq Composite, the only one of the "big 3" major indices still holding above its intermediate-term uptrend line,
stalled after probing a few points above pivotal resistance of its 200-day moving average. Worse, the index is still in the precarious position of forming the right shoulder of a bearish "head and shoulders" pattern
The weakest of the "big 3" broad- based indexes, the Dow Jones Industrial Average reversed after running into resistance of its 50-day MA and coming within a few points of its 20-day EMA. After the Dow broke below support of its 50-day MA on May 21, that key moving average became the new resistance level. As such,
it's not surprising that the Dow ran stops above the 50-day MA, but failed to actually close above it.


