
|
|
|
US - Market Direction 01 (May 08 - Jul 08)
Re: US - Market Direction
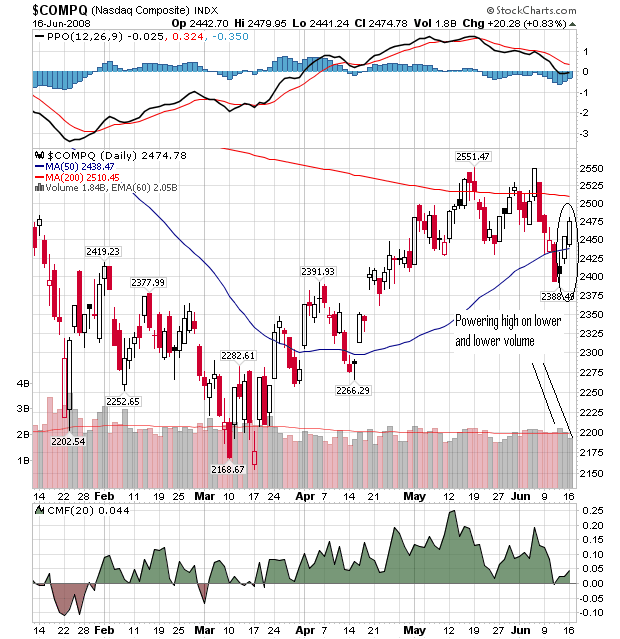
![]() by kennynah » Sat Jun 14, 2008 11:05 pm
by kennynah » Sat Jun 14, 2008 11:05 pm
i do not consider the uptick as having low volume... see chart below
Options Strategies & Discussions  .(Trading Discipline : The Science of Constantly Acting on Knowledge Consistently - kennynah).Investment Strategies & Ideas
 ..................................................................<A fool gives full vent to his anger, but a wise man keeps himself under control-Proverbs 29:11>.................................................................
.(Trading Discipline : The Science of Constantly Acting on Knowledge Consistently - kennynah).Investment Strategies & Ideas-

kennynah - Lord of the Lew Lian
- Posts: 14201
- Joined: Wed May 07, 2008 2:00 am
- Location: everywhere.. and nowhere..
Re: US - Market Direction
![]() by winston » Sat Jun 14, 2008 11:20 pm
by winston » Sat Jun 14, 2008 11:20 pm
millionairemind wrote:
How about the following 4 examples??? Dark enough for you??
Hi MM,
What I'm trying to say is that the reasons for last week's decline of 600 points in 2 days, is not a big reason to instill fear. Therefore, I dont see another steep drop over the next few days.
A "Chinese Water Torture" could be possible. This is where the market drip 50 points a day, for a few days in a row as sentiment is not so good..
However, my instinct tells me that there could be technical rebound as the reason for the steep drop, is just not strong enough to instill fear..
Take care,
Winston
It's all about "how much you made when you were right" & "how little you lost when you were wrong"
-

winston - Billionaire Boss
- Posts: 112727
- Joined: Wed May 07, 2008 9:28 am
Re: US - Market Direction
![]() by HengHeng » Sun Jun 15, 2008 2:00 am
by HengHeng » Sun Jun 15, 2008 2:00 am
you need to check the COTs
Beh Ki Jiu Lou , Beh lou Jiu Ki lor < Newton's law of gravity , but what don't might not come back
In the game of poker , "if you've been in the game 30mins and you don't know who the patsy is, you are the patsy
In the game of poker , "if you've been in the game 30mins and you don't know who the patsy is, you are the patsy
-

HengHeng - Permanent Loafer
- Posts: 620
- Joined: Wed May 07, 2008 2:13 pm
Re: US - Market Direction
![]() by winston » Mon Jun 16, 2008 2:26 pm
by winston » Mon Jun 16, 2008 2:26 pm
From CIMB:-
Global Equity Technicals - Sharp spike in oil soon?
Bull or bear – it’s all down to the correction. As we have maintained over the past fortnight, whether the S&P500 is in a bull or bear market all depends on its correction.
Based on its weekly indicators, there is a good chance that the index will fall back towards its 61.8% Fibonacci retracement (FR) level at 1,326 or even retest its Mar 08 low of 1,256. A correction below the mid-Mar low would mean that the bears are not exiting yet.
For the Dow Jones Industrials, the crucial support is its Jan-08 lows of 11,637. Minor rebound early on but... Selling pressure is about to set in again. It appears that almost all of the global indices are in a similar situation. We expect almost all of the indices to see follow-through buying early this week before succumbing to further selling pressure.
It's all about "how much you made when you were right" & "how little you lost when you were wrong"
-
winston - Billionaire Boss
- Posts: 112727
- Joined: Wed May 07, 2008 9:28 am
Re: US - Market Direction
![]() by millionairemind » Mon Jun 16, 2008 3:35 pm
by millionairemind » Mon Jun 16, 2008 3:35 pm
Wall Street braces for more turbulence
Fed's stance this week will be closely watched; storm gathers at Lehman
By ANDREW MARKS
NEW YORK CORRESPONDENT
LAST week saw no shortage of action in the US equity markets and most of it was bad, as stocks were whipsawed by fluctuating oil prices and fears that inflation might force the US Federal Reserve to start raising interest rates even as the economy continues to totter on the edge of a recession that many analysts believe has already occurred.
'The consumer price report was just a huge psychological shot in the arm.'
- SG Cowen head equity trader John O'Donoghue
But a key inflation report provided investors with a life raft's worth of relief on Friday, indicating that inflation remains tame aside from food and energy prices.
Coupled with a huge rally in the US dollar, which posted its best weekly performance in three years against the euro and in four years against the yen, and the announcement that Saudi Arabia is increasing its oil output to record levels in an effort to keep prices down, traders left for the weekend buoyed by hope where there appeared to be none as recently as last Thursday's close.
'The consumer price report was just a huge psychological shot in the arm for the stock market, which, between oil prices and what's been happening with Lehman Brothers, was looking like we were heading for a major capitulation. It made everyone pause and say maybe things aren't quite as bad as they've been looking lately,' said John O'Donoghue, head equity trader at SG Cowen.
Whether that glimmer of optimism can carry over into this week is a big question, however, as Wall Street frets over whether Lehman Brothers is heading in the same direction as Bear Stearns, what the US central bank will be doing at the upcoming meeting of the Federal Open Market Committee, if oil prices will retreat and when the banks will be done writing off their losses so they can start lending again.
'We generally believe the stock market is going higher; but for the short term, we are staying bearish on stocks,' said Shannon Puls, managing director at investment research and trading advisory firm earningswhispers.com, who said that he is shorting the S&P 500 right now.
'The market has a lot of volatility in store with the uncertainty over the Fed and going into what's going to be a tough second-quarter earnings season, and we believe the action will be to the downside until we get to some solid ground,' he said.
The stock market's gains last Friday were certainly solid after the release of the inflation data and a decline in oil prices that brought the cost per barrel down US$2 to US$134. A week after its single day swoon of more than 300 points, the Dow Jones Industrial Average leapt 165.77 points, or 1.4 per cent, to end at 12,307.35.
The S&P 500 climbed 20.16 points, or 1.5 per cent, to settle at 1,360.03. The Nasdaq Composite gained 50.15 points, or 2.1 per cent, to end at 2,454.50.
For the week, blue chips gained 0.8 per cent to end at 12,307.35, while the S&P 500 finished less than a point lower at 1360.03, and the Nasdaq Composite Index dropped about 0.8 per cent in the five-day period to end the week at 2454.50.
In order to repeat that performance, investors will need to see more strength in the US dollar, which should help push down the prices of oil and other commodities, and further encouraging economic data on inflation.
'It would be a win for the market if the Fed could take a more neutral stance on interest rates as it attempts to balance keeping a lid on inflationary pressures against supporting the weak economy,' said Mr Puls.
Given the importance of the inflation question, tomorrow's release of the producer price index will be closely watched by investors. The day also brings release of May industrial production numbers, which showed a 0.7 per cent decline in April, and housing starts from the Census Bureau.
The New York Empire State Index of economic activity is due today. On Wednesday, the EIA is scheduled to report on crude oil and petrol supplies. Thursday brings weekly jobless numbers, while the Philadelphia Fed Index and leading indicators will also be disclosed.
The second-quarter earnings reporting season's 'official' opening is still two weeks away, but some interesting earnings are on tap this week for investors, staring with Lehman Brothers today. The embattled Wall Street firm could have bigger news than earnings, however, as senior executives were reportedly huddling at weekend meetings amid speculation that the firm may soon be sold.
Goldman Sachs reports its earnings tomorrow, while Morgan Stanley comes out Wednesday.
FedEx also reports earnings on Wednesday. Many investors consider the shipping giant a bellwether for the economy, and its numbers will be scrutinised for the impact of rising energy prices.
"If a speculator is correct half of the time, he is hitting a good average. Even being right 3 or 4 times out of 10 should yield a person a fortune if he has the sense to cut his losses quickly on the ventures where he has been wrong" - Bernard Baruch
Disclaimer - The author may at times own some of the stocks mentioned in this forum. All discussions are NOT to be construed as buy/sell recommendations. Readers are advised to do their own research and analysis.
Disclaimer - The author may at times own some of the stocks mentioned in this forum. All discussions are NOT to be construed as buy/sell recommendations. Readers are advised to do their own research and analysis.
-

millionairemind - Big Boss
- Posts: 7776
- Joined: Wed May 07, 2008 8:50 am
- Location: The Matrix
Re: US - Market Direction
![]() by littlecupid » Mon Jun 16, 2008 5:31 pm
by littlecupid » Mon Jun 16, 2008 5:31 pm
Sorry to side track...MM or any trader experts...can you help to show where to find shorting level in the US market ? Thanks 
- littlecupid
- Loafer
- Posts: 47
- Joined: Wed May 14, 2008 11:04 am
Re: US - Market Direction
![]() by millionairemind » Mon Jun 16, 2008 5:54 pm
by millionairemind » Mon Jun 16, 2008 5:54 pm
Hi LC,
We are all students of the market. No experts here...we just like to exchange ideas
Here is a website I use for individual stock short positions.
http://www.shortsqueeze.com/
Many times a powerful short squeeze will result in a strong rally due to short covering.
As for the total short interest ratio for NYSE, I subscribe to an investment newsletter call Investors Business Daily which tracks this on a daily basis.
The current NYSE short interest ratio is 13.92 , which is very close to the high year high of 14.45 set about a few days ago. To give you a relative magnitude for comparison, at the start of the January correction, it was was around 10.
We each have to infer on what this means for our strategy
I hope this helps.
Regards,
mm
"If a speculator is correct half of the time, he is hitting a good average. Even being right 3 or 4 times out of 10 should yield a person a fortune if he has the sense to cut his losses quickly on the ventures where he has been wrong" - Bernard Baruch
Disclaimer - The author may at times own some of the stocks mentioned in this forum. All discussions are NOT to be construed as buy/sell recommendations. Readers are advised to do their own research and analysis.
Disclaimer - The author may at times own some of the stocks mentioned in this forum. All discussions are NOT to be construed as buy/sell recommendations. Readers are advised to do their own research and analysis.
-
millionairemind - Big Boss
- Posts: 7776
- Joined: Wed May 07, 2008 8:50 am
- Location: The Matrix
Re: US - Market Direction
![]() by littlecupid » Mon Jun 16, 2008 6:02 pm
by littlecupid » Mon Jun 16, 2008 6:02 pm
Thanks MM
Looks like short interest is quite high.... if the banks post relatively not as bad numbers and oil goes down.... there might be a small rally...
Looks like short interest is quite high.... if the banks post relatively not as bad numbers and oil goes down.... there might be a small rally...
- littlecupid
- Loafer
- Posts: 47
- Joined: Wed May 14, 2008 11:04 am
Re: US - Market Direction
![]() by millionairemind » Tue Jun 17, 2008 8:50 am
by millionairemind » Tue Jun 17, 2008 8:50 am
Nasdaq is still the leading index, bouncing off the 50DMA. It singlehandedly dragged the other 3 indices along 
However, it is powering higher and higher on lower and lower volume.... Market is still in a correction.
Today marks Day 3 of attempt rally by Nasdaq (on lower volume). Overall market breadth and health IMO is not good cos' index is being swayed intraday or even intra-hour by oil prices. This is not a healthy market.
NYSE short interest ratio still stands at 13.90. Just be careful out there if you are in the market (either long or short)
"If a speculator is correct half of the time, he is hitting a good average. Even being right 3 or 4 times out of 10 should yield a person a fortune if he has the sense to cut his losses quickly on the ventures where he has been wrong" - Bernard Baruch
Disclaimer - The author may at times own some of the stocks mentioned in this forum. All discussions are NOT to be construed as buy/sell recommendations. Readers are advised to do their own research and analysis.
Disclaimer - The author may at times own some of the stocks mentioned in this forum. All discussions are NOT to be construed as buy/sell recommendations. Readers are advised to do their own research and analysis.
-
millionairemind - Big Boss
- Posts: 7776
- Joined: Wed May 07, 2008 8:50 am
- Location: The Matrix
Re: US - Market Direction
![]() by kennynah » Tue Jun 17, 2008 10:25 am
by kennynah » Tue Jun 17, 2008 10:25 am
generally concur with MM's views.
In addition, i note the following:
a) the other 3 major indexes traded at a markedly lower volumes as well
b) although Oil appeared to have rallied initially even on the "bad" news that saudi will increase by additional 200K barrels/day and saudi king's remark that oil price is too high, it nevertheless ended in -ve territory.... this could mean, that oil trading is not euphoric as it has not become illogical. this could mean, price can increase further
c) gold, initially made a gain of some $21/ounce, ended paring it's gains by 1/2. but i am not so worried about this spineless metal... for now, it is swayed by rather than a swayer of markets.
i choose to show DJIA chart, as it is the worst of the 3 sister indexes... one can then imagine a slightly better chart pattern for SP500 and Nazdaq
DJIA 15 Mins Chart
Options Strategies & Discussions .(Trading Discipline : The Science of Constantly Acting on Knowledge Consistently - kennynah).Investment Strategies & Ideas
..................................................................<A fool gives full vent to his anger, but a wise man keeps himself under control-Proverbs 29:11>.................................................................
.(Trading Discipline : The Science of Constantly Acting on Knowledge Consistently - kennynah).Investment Strategies & Ideas-
kennynah - Lord of the Lew Lian
- Posts: 14201
- Joined: Wed May 07, 2008 2:00 am
- Location: everywhere.. and nowhere..
Who is online
Users browsing this forum: No registered users and 1 guest