W,
I am still net short.... I am concerned with the high NYSE short ratio... If the bears win.. it will be a bloodletting exercise... and I think worse than what we have seen in January. Current NYSE short ratio is around 13.95. At the start of Jan correction, it was only 10.. that is how much shorting has been done...
We are 2 weeks into this correction and the attempt rebound by Nasdaq was blunted by the bears last night.
Having said that, last night drop was on lower volume.
The rally attempt is still intact... If it is successful this week, it will be the shortest correction I have ever seen.
The VIX is increasing...
I am still watching it.. if the rally is successful, I will flip back to the long side.
Hope this helps.
Cheers,
mm
|
|
|
US - Market Direction 01 (May 08 - Jul 08)
Re: US - Market Direction
![]() by millionairemind » Tue Jun 03, 2008 10:33 am
by millionairemind » Tue Jun 03, 2008 10:33 am
"If a speculator is correct half of the time, he is hitting a good average. Even being right 3 or 4 times out of 10 should yield a person a fortune if he has the sense to cut his losses quickly on the ventures where he has been wrong" - Bernard Baruch
Disclaimer - The author may at times own some of the stocks mentioned in this forum. All discussions are NOT to be construed as buy/sell recommendations. Readers are advised to do their own research and analysis.
Disclaimer - The author may at times own some of the stocks mentioned in this forum. All discussions are NOT to be construed as buy/sell recommendations. Readers are advised to do their own research and analysis.
-

millionairemind - Big Boss
- Posts: 7776
- Joined: Wed May 07, 2008 8:50 am
- Location: The Matrix
Re: US - Market Direction
![]() by kennynah » Tue Jun 03, 2008 10:44 am
by kennynah » Tue Jun 03, 2008 10:44 am
frankly, TA, like FA, also have "short", "medium" and "long" term outlooks...
obviously, for swing traders, what matters most is the next minute, hour and by the end of that session. and so, forming an immediate opnion is most crucial and he might look into 5-15mins charts of the last 5 days, to determine entry and exit points.
a medium term TA, may look at only daily(and occasional weekly) charts to draw some conclusions, but weekly and even monthly charts are only seen by long term TA chartists.
having said all these, a chart when seen by 2 different person, can offer many propositions...
it is therefore, actually, safest to draw one's own conclusion, becos i may see a beauty, but u see a beast....
Options Strategies & Discussions  .(Trading Discipline : The Science of Constantly Acting on Knowledge Consistently - kennynah).Investment Strategies & Ideas
 ..................................................................<A fool gives full vent to his anger, but a wise man keeps himself under control-Proverbs 29:11>.................................................................
.(Trading Discipline : The Science of Constantly Acting on Knowledge Consistently - kennynah).Investment Strategies & Ideas-

kennynah - Lord of the Lew Lian
- Posts: 14201
- Joined: Wed May 07, 2008 2:00 am
- Location: everywhere.. and nowhere..
Re: US - Market Direction
![]() by millionairemind » Tue Jun 03, 2008 11:09 am
by millionairemind » Tue Jun 03, 2008 11:09 am
kennynah wrote:having said all these, a chart when seen by 2 different person, can offer many propositions...
it is therefore, actually, safest to draw one's own conclusion, becos i may see a beauty, but u see a beast....
Agree with K... everybody does it differently.
My style works for me cos' it complements my character and personality to a T... it might not work for others.
I am just commenting based solely on my (limited) experience..(or inexperience)
"If a speculator is correct half of the time, he is hitting a good average. Even being right 3 or 4 times out of 10 should yield a person a fortune if he has the sense to cut his losses quickly on the ventures where he has been wrong" - Bernard Baruch
Disclaimer - The author may at times own some of the stocks mentioned in this forum. All discussions are NOT to be construed as buy/sell recommendations. Readers are advised to do their own research and analysis.
Disclaimer - The author may at times own some of the stocks mentioned in this forum. All discussions are NOT to be construed as buy/sell recommendations. Readers are advised to do their own research and analysis.
-
millionairemind - Big Boss
- Posts: 7776
- Joined: Wed May 07, 2008 8:50 am
- Location: The Matrix
Re: US - Market Direction
![]() by kennynah » Tue Jun 03, 2008 11:22 am
by kennynah » Tue Jun 03, 2008 11:22 am
i oso agree with MM....
some like using right hand, some like it left hand...in the end, still get satisfied..
eating that bowl of mee pok dry with extra chilli...using chopsticks...
some like using right hand, some like it left hand...in the end, still get satisfied..
eating that bowl of mee pok dry with extra chilli...using chopsticks...
Options Strategies & Discussions .(Trading Discipline : The Science of Constantly Acting on Knowledge Consistently - kennynah).Investment Strategies & Ideas
..................................................................<A fool gives full vent to his anger, but a wise man keeps himself under control-Proverbs 29:11>.................................................................
.(Trading Discipline : The Science of Constantly Acting on Knowledge Consistently - kennynah).Investment Strategies & Ideas-
kennynah - Lord of the Lew Lian
- Posts: 14201
- Joined: Wed May 07, 2008 2:00 am
- Location: everywhere.. and nowhere..
Re: US - Market Direction
![]() by Cherry » Tue Jun 03, 2008 11:37 am
by Cherry » Tue Jun 03, 2008 11:37 am
Hi Millionairemind
You mentioned:
'The VIX is increasing... ' and,
'I am concerned with the high NYSE short ratio... '
Could you please:
1. Tell me what is VIX?
2. Tell me where can I see the data for the NYSE short/long ratios? Are there such data for other markets, eg SGX, HSI, SSE, etc?
3. Enlighten me on how to interpret the VIX and NYSE short/long ratio readings?
Thank you.
- Cherry
- Foreman
- Posts: 391
- Joined: Tue May 13, 2008 1:24 pm
Re: US - Market Direction
![]() by millionairemind » Tue Jun 03, 2008 12:14 pm
by millionairemind » Tue Jun 03, 2008 12:14 pm
Hello Cherry,
So nice to see you here in Huatopedia and your posts...
As for VIX..it is what I like to call the FEAR index.
VIX is the ticker symbol for the Chicago Board Options Exchange Volatility Index, a popular measure of the implied volatility of S&P 500 index options. Referred to by some as the fear index, it represents one measure of the market's expectation of volatility over the next 30 day period.
http://en.wikipedia.org/wiki/VIX
Here is a chart... VIX will be heightened when mkt becomes volatile.. you will see that VIX is highest when the fear is strongest.
Here is a place where you can go look at the charts.
http://stockcharts.com/charts/gallery.html?$VIX
The NYSE Short Interest Ratio is a contrary opinion sentiment indicator used to determine the sentiment of the overall market. It is calculated by dividing the monthly short interest figure released by the New York Stock Exchange by the average daily composite NYSE volume. The Short Interest Ratio is therefore an excellent indicator of optimism or pessimism in the market.
Here is a chart which might help explain.. This was a snapshort of short interest ratio last Friday.
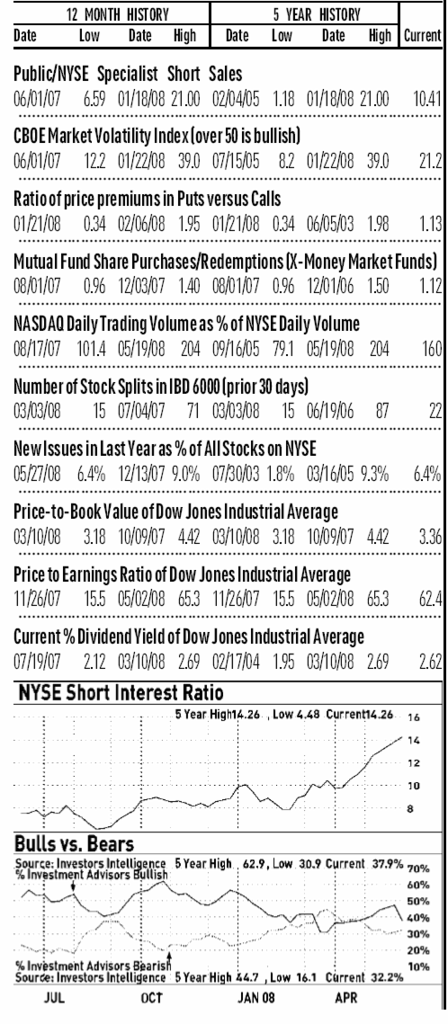
Either the BEARS win and result in bloodshed or the BULLS win and result in a strong rally and massive short covering..
We all have to take one side..
Hope this helps.
So nice to see you here in Huatopedia and your posts...
As for VIX..it is what I like to call the FEAR index.
VIX is the ticker symbol for the Chicago Board Options Exchange Volatility Index, a popular measure of the implied volatility of S&P 500 index options. Referred to by some as the fear index, it represents one measure of the market's expectation of volatility over the next 30 day period.
http://en.wikipedia.org/wiki/VIX
Here is a chart... VIX will be heightened when mkt becomes volatile.. you will see that VIX is highest when the fear is strongest.
Here is a place where you can go look at the charts.
http://stockcharts.com/charts/gallery.html?$VIX
The NYSE Short Interest Ratio is a contrary opinion sentiment indicator used to determine the sentiment of the overall market. It is calculated by dividing the monthly short interest figure released by the New York Stock Exchange by the average daily composite NYSE volume. The Short Interest Ratio is therefore an excellent indicator of optimism or pessimism in the market.
Here is a chart which might help explain.. This was a snapshort of short interest ratio last Friday.
Either the BEARS win and result in bloodshed or the BULLS win and result in a strong rally and massive short covering..
We all have to take one side..
Hope this helps.
Last edited by millionairemind on Tue Jun 03, 2008 3:30 pm, edited 1 time in total.
"If a speculator is correct half of the time, he is hitting a good average. Even being right 3 or 4 times out of 10 should yield a person a fortune if he has the sense to cut his losses quickly on the ventures where he has been wrong" - Bernard Baruch
Disclaimer - The author may at times own some of the stocks mentioned in this forum. All discussions are NOT to be construed as buy/sell recommendations. Readers are advised to do their own research and analysis.
Disclaimer - The author may at times own some of the stocks mentioned in this forum. All discussions are NOT to be construed as buy/sell recommendations. Readers are advised to do their own research and analysis.
-
millionairemind - Big Boss
- Posts: 7776
- Joined: Wed May 07, 2008 8:50 am
- Location: The Matrix
Re: US - Market Direction
![]() by Cherry » Tue Jun 03, 2008 1:39 pm
by Cherry » Tue Jun 03, 2008 1:39 pm
Hi Millionairemind
Thanks a lot. I will try to understand, digest and use the info. Really appreciate your prompt reply and value your info.
Thanks a lot. I will try to understand, digest and use the info. Really appreciate your prompt reply and value your info.
- Cherry
- Foreman
- Posts: 391
- Joined: Tue May 13, 2008 1:24 pm
Re: US - Market Direction
![]() by bertyeo » Tue Jun 03, 2008 8:05 pm
by bertyeo » Tue Jun 03, 2008 8:05 pm
good read indeed...thank MM
Cheers
Cheers
"Die for something or Live for nothing"
-

bertyeo - Loafer
- Posts: 79
- Joined: Thu May 15, 2008 7:33 am
Re: US - Market Direction
![]() by kennynah » Wed Jun 04, 2008 5:29 am
by kennynah » Wed Jun 04, 2008 5:29 am
Indexes fell badly...
ALL indexes' Volume were markedly higher, including NYSE Composite
the stories within the charts...
good luck.... and please do note, that nothing drops without bouncing off...and nothing naturally defies gravity...
((click on the picture to enlarge))
SP500 - Maybe Catching a Cold

Nazdaq - The best behaved kid

DOW - In Coma

VIX >>> The School HeadMaster - Tries to Maintain Order

ALL indexes' Volume were markedly higher, including NYSE Composite
the stories within the charts...
good luck.... and please do note, that nothing drops without bouncing off...and nothing naturally defies gravity...
((click on the picture to enlarge))
SP500 - Maybe Catching a Cold
Nazdaq - The best behaved kid
DOW - In Coma
VIX >>> The School HeadMaster - Tries to Maintain Order
Options Strategies & Discussions .(Trading Discipline : The Science of Constantly Acting on Knowledge Consistently - kennynah).Investment Strategies & Ideas
..................................................................<A fool gives full vent to his anger, but a wise man keeps himself under control-Proverbs 29:11>.................................................................
.(Trading Discipline : The Science of Constantly Acting on Knowledge Consistently - kennynah).Investment Strategies & Ideas-
kennynah - Lord of the Lew Lian
- Posts: 14201
- Joined: Wed May 07, 2008 2:00 am
- Location: everywhere.. and nowhere..
Re: US - Market Direction
![]() by millionairemind » Wed Jun 04, 2008 8:34 am
by millionairemind » Wed Jun 04, 2008 8:34 am
K - Great charts...and I liked the way you labelled the indices...esp. Ah DOW In Coma haha.. 
Technically speaking, Nasdaq still in attempt rally mode but the other 3 indices have all undercut their lows and dead...
I think it is a matter of time the rotten apples in the basket will drag down the one good apple... Time will tell which side will win..
Technically speaking, Nasdaq still in attempt rally mode but the other 3 indices have all undercut their lows and dead...
I think it is a matter of time the rotten apples in the basket will drag down the one good apple... Time will tell which side will win..
"If a speculator is correct half of the time, he is hitting a good average. Even being right 3 or 4 times out of 10 should yield a person a fortune if he has the sense to cut his losses quickly on the ventures where he has been wrong" - Bernard Baruch
Disclaimer - The author may at times own some of the stocks mentioned in this forum. All discussions are NOT to be construed as buy/sell recommendations. Readers are advised to do their own research and analysis.
Disclaimer - The author may at times own some of the stocks mentioned in this forum. All discussions are NOT to be construed as buy/sell recommendations. Readers are advised to do their own research and analysis.
-
millionairemind - Big Boss
- Posts: 7776
- Joined: Wed May 07, 2008 8:50 am
- Location: The Matrix
Who is online
Users browsing this forum: No registered users and 3 guests