MM : appreciate your thoughts and inputs...
basically, i like what i see as an up channel of the sp500, which started in Mar08...hence in the widerscope, i am bullish bias..
but since i trade, i am acutely aware of the swings... this channel serves to tell me when to buy, and when to sell... planning ahead with counters in my "put watchlist" and "call watchlist", so as to be able to act on them dependng on the index movement..
|
|
|
US - Market Direction 01 (May 08 - Jul 08)
Re: SP500 Technical Analysis - Ongoing
![]() by kennynah » Tue May 13, 2008 1:18 am
by kennynah » Tue May 13, 2008 1:18 am
Options Strategies & Discussions  .(Trading Discipline : The Science of Constantly Acting on Knowledge Consistently - kennynah).Investment Strategies & Ideas
 ..................................................................<A fool gives full vent to his anger, but a wise man keeps himself under control-Proverbs 29:11>.................................................................
.(Trading Discipline : The Science of Constantly Acting on Knowledge Consistently - kennynah).Investment Strategies & Ideas-

kennynah - Lord of the Lew Lian
- Posts: 14201
- Joined: Wed May 07, 2008 2:00 am
- Location: everywhere.. and nowhere..
Re: Market Direction
![]() by kennynah » Tue May 13, 2008 3:18 am
by kennynah » Tue May 13, 2008 3:18 am
MM : thanks for this input...always great to have this served up in a chart... visual helps alot.
San : a great point you brought up... <<hammer (tonkachi) @ 14april>>
i like to add on... "hammers" are particular indicative of a bottom when it lies outside the lower Bollinger Bands... if it doesnt lie outside, then sometimes, it can give a wrong signal... similarly, this BB rule applies to "reverse hammers" to suggest a top...
in any case, all TA indicators should not be read by itself, but along with other TAs to lend further confirmations on signal.
finally, i wish to highlight that since all indexes are "recovering"ie. retracing their losses since Dec07... therefore, we should be aware of the Fibonacci Retracements at this time :
Nazdaq
61.8% = ~ 2,509 (next resistance)
50% = ~ 2,441(support)
DOW
50% = ~12, 948 (resistance)
38.2% = ~12,660 (support)
SP500
50% = ~1,418 (resistance)
38.2% = ~1.378 (support)
Options Strategies & Discussions .(Trading Discipline : The Science of Constantly Acting on Knowledge Consistently - kennynah).Investment Strategies & Ideas
..................................................................<A fool gives full vent to his anger, but a wise man keeps himself under control-Proverbs 29:11>.................................................................
.(Trading Discipline : The Science of Constantly Acting on Knowledge Consistently - kennynah).Investment Strategies & Ideas-
kennynah - Lord of the Lew Lian
- Posts: 14201
- Joined: Wed May 07, 2008 2:00 am
- Location: everywhere.. and nowhere..
Re: Market Direction
![]() by kennynah » Tue May 13, 2008 3:56 am
by kennynah » Tue May 13, 2008 3:56 am
12/13 May 08 :
I dont wish to douse a rally night's interest, but please be fully aware that CBOE VIX is now ~18. This low is matched only in Dec07...and we all know what happened after that....indexes tanked subsequent to VIX reaching this level.
I am not suggesting that VIX at such low level, indicates that the indexes consequently dive like it did before...
BUT....
just be aware that Technically, VIX looks like a rebound...
Options Strategies & Discussions .(Trading Discipline : The Science of Constantly Acting on Knowledge Consistently - kennynah).Investment Strategies & Ideas
..................................................................<A fool gives full vent to his anger, but a wise man keeps himself under control-Proverbs 29:11>.................................................................
.(Trading Discipline : The Science of Constantly Acting on Knowledge Consistently - kennynah).Investment Strategies & Ideas-
kennynah - Lord of the Lew Lian
- Posts: 14201
- Joined: Wed May 07, 2008 2:00 am
- Location: everywhere.. and nowhere..
Re: Market Direction
![]() by millionairemind » Wed May 14, 2008 8:40 pm
by millionairemind » Wed May 14, 2008 8:40 pm
One thing to note about the current uptrend is that the NYSE short interest ratio is now at an all time 5-yr high.
My interpretation is too many ppe. still expect the mkt to tank so they are shorting heavily.. 2 things can happen.
1. A few pieces of good economic news will trigger massive short covering and a powerful surge in the indices
2. The BEARS are right and they have enough financial power to bring down the index.
Which is which, just sit tight and watch the good show..
"If a speculator is correct half of the time, he is hitting a good average. Even being right 3 or 4 times out of 10 should yield a person a fortune if he has the sense to cut his losses quickly on the ventures where he has been wrong" - Bernard Baruch
Disclaimer - The author may at times own some of the stocks mentioned in this forum. All discussions are NOT to be construed as buy/sell recommendations. Readers are advised to do their own research and analysis.
Disclaimer - The author may at times own some of the stocks mentioned in this forum. All discussions are NOT to be construed as buy/sell recommendations. Readers are advised to do their own research and analysis.
-

millionairemind - Big Boss
- Posts: 7776
- Joined: Wed May 07, 2008 8:50 am
- Location: The Matrix
Re: Market Direction
![]() by kennynah » Wed May 14, 2008 8:54 pm
by kennynah » Wed May 14, 2008 8:54 pm
i still end up repeating that 1418 sp500 is a crucial resistance which needs to be broken very convincingly... and 1380 is a critical support...
let me toss a coin....i say, tonight market will rally.
let me toss a coin....i say, tonight market will rally.
Options Strategies & Discussions .(Trading Discipline : The Science of Constantly Acting on Knowledge Consistently - kennynah).Investment Strategies & Ideas
..................................................................<A fool gives full vent to his anger, but a wise man keeps himself under control-Proverbs 29:11>.................................................................
.(Trading Discipline : The Science of Constantly Acting on Knowledge Consistently - kennynah).Investment Strategies & Ideas-
kennynah - Lord of the Lew Lian
- Posts: 14201
- Joined: Wed May 07, 2008 2:00 am
- Location: everywhere.. and nowhere..
Re: End of Day Market Summary - Ongoing
![]() by kennynah » Thu May 15, 2008 4:11 am
by kennynah » Thu May 15, 2008 4:11 am
day ended 14may08 (wed)
dow = +ve 66 @ 12998
sp500 = +ve 5 @ 1408
nazdaq = +ve 2 @ 2496
Oil settled at ~$124 (down $1.80)
Gold (jun) ~ $865 (down $6)
SP500 tested 1418(resistance) and actually penetrated it up to 1420...on the back of a better than expected CPI numbers (see viewtopic.php?f=11&t=242#p1288 for detailed figures) or read the below summary:
The Labor Department's report that consumer prices advanced 0.2 percent in April after rising 0.3 percent in March appeared to alleviate worries about a big spike in prices due to the recent surge in energy costs. The moderation in prices comes despite the largest jump in food prices in 18 years.
click on this picture to get a clearer view
Options Strategies & Discussions .(Trading Discipline : The Science of Constantly Acting on Knowledge Consistently - kennynah).Investment Strategies & Ideas
..................................................................<A fool gives full vent to his anger, but a wise man keeps himself under control-Proverbs 29:11>.................................................................
.(Trading Discipline : The Science of Constantly Acting on Knowledge Consistently - kennynah).Investment Strategies & Ideas-
kennynah - Lord of the Lew Lian
- Posts: 14201
- Joined: Wed May 07, 2008 2:00 am
- Location: everywhere.. and nowhere..
Re: Market Direction
![]() by winston » Thu May 15, 2008 8:22 am
by winston » Thu May 15, 2008 8:22 am
The Volatility Index $VIX which measures the cost of insuring against losses in the S&P500 fell to a new yearly low of 16.20.
It's all about "how much you made when you were right" & "how little you lost when you were wrong"
-

winston - Billionaire Boss
- Posts: 112727
- Joined: Wed May 07, 2008 9:28 am
Re: End of Day Market Summary - Ongoing
![]() by millionairemind » Thu May 15, 2008 9:48 am
by millionairemind » Thu May 15, 2008 9:48 am
The indices all hit their 200DMA and then turned tail for the day. Major resistance at 200DMA for Nasdaq, NYSE, DOW. S&P500 200DMA at 1530..
Hope we pierced thro' them swee swee soon...
Hope we pierced thro' them swee swee soon...
"If a speculator is correct half of the time, he is hitting a good average. Even being right 3 or 4 times out of 10 should yield a person a fortune if he has the sense to cut his losses quickly on the ventures where he has been wrong" - Bernard Baruch
Disclaimer - The author may at times own some of the stocks mentioned in this forum. All discussions are NOT to be construed as buy/sell recommendations. Readers are advised to do their own research and analysis.
Disclaimer - The author may at times own some of the stocks mentioned in this forum. All discussions are NOT to be construed as buy/sell recommendations. Readers are advised to do their own research and analysis.
-
millionairemind - Big Boss
- Posts: 7776
- Joined: Wed May 07, 2008 8:50 am
- Location: The Matrix
Re: Market Direction
![]() by kennynah » Thu May 15, 2008 3:27 pm
by kennynah » Thu May 15, 2008 3:27 pm
this VIX is a ongoing concern at such low level for bulls... it is now lower than last 4Q07 levels... worrying..
Options Strategies & Discussions .(Trading Discipline : The Science of Constantly Acting on Knowledge Consistently - kennynah).Investment Strategies & Ideas
..................................................................<A fool gives full vent to his anger, but a wise man keeps himself under control-Proverbs 29:11>.................................................................
.(Trading Discipline : The Science of Constantly Acting on Knowledge Consistently - kennynah).Investment Strategies & Ideas-
kennynah - Lord of the Lew Lian
- Posts: 14201
- Joined: Wed May 07, 2008 2:00 am
- Location: everywhere.. and nowhere..
Re: Market Direction - US
![]() by millionairemind » Thu May 15, 2008 8:36 pm
by millionairemind » Thu May 15, 2008 8:36 pm
K/W,
Check out the weekly charts for VIX...
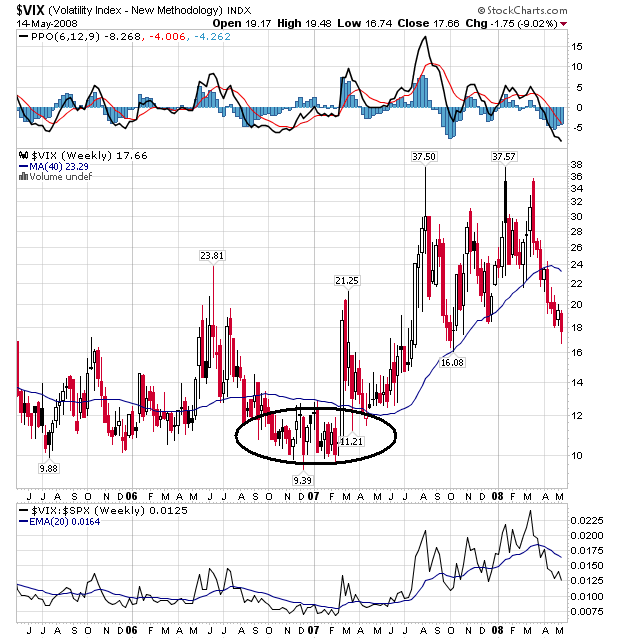
After the follow thro' in Aug 2006.. the VIX stayed low all the way thro' till the next correction in late Feb 07. That is a 6month uptrend, which Asia followed very closely.
Cheers,
mm
Check out the weekly charts for VIX...
After the follow thro' in Aug 2006.. the VIX stayed low all the way thro' till the next correction in late Feb 07. That is a 6month uptrend, which Asia followed very closely.
Cheers,
mm
Last edited by millionairemind on Fri May 16, 2008 7:01 am, edited 2 times in total.
"If a speculator is correct half of the time, he is hitting a good average. Even being right 3 or 4 times out of 10 should yield a person a fortune if he has the sense to cut his losses quickly on the ventures where he has been wrong" - Bernard Baruch
Disclaimer - The author may at times own some of the stocks mentioned in this forum. All discussions are NOT to be construed as buy/sell recommendations. Readers are advised to do their own research and analysis.
Disclaimer - The author may at times own some of the stocks mentioned in this forum. All discussions are NOT to be construed as buy/sell recommendations. Readers are advised to do their own research and analysis.
-
millionairemind - Big Boss
- Posts: 7776
- Joined: Wed May 07, 2008 8:50 am
- Location: The Matrix
Who is online
Users browsing this forum: No registered users and 1 guest