Page 1 of 2

Alexandria Real Estate Inc (ARE)

PostPosted: Tue Mar 03, 2009 10:06 am
by iam802
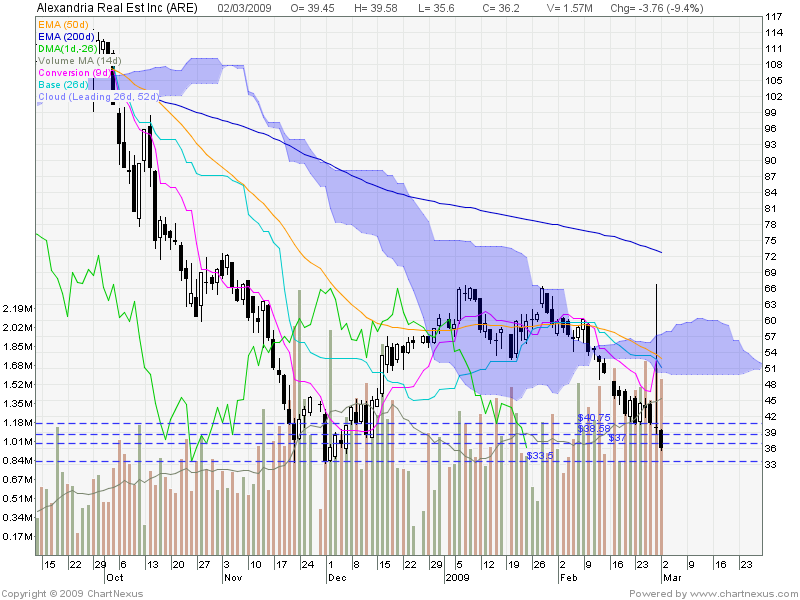
look at how this REIT is tumbling...

perhaps, when the news on banks becomes out of fashion......next to hit the headlines will be the REITs.

Image

Re: Alexandria Real Estate Inc (ARE)

PostPosted: Fri Mar 06, 2009 12:25 am
by iam802
hovering just about $33 now...

Re: Alexandria Real Estate Inc (ARE)

PostPosted: Fri Mar 06, 2009 11:27 pm
by iam802
33 is breached.

http://stockcharts.com/h-sc/ui?s=ARE&p= ... 0987395393

More free fall coming for this

Re: Alexandria Real Estate Inc (ARE)

PostPosted: Fri Mar 20, 2009 12:11 am
by iam802
weird chart..or is someone trying to manipulate prices?

If you look at ARE chart, you will noticed that in March there is a spike for the price that goes to about 65

http://stockcharts.com/h-sc/ui?s=ARE&p= ... 9371219684

Today, on my trading platform, it also shows a spike that goes to 95.90!!!

Re: Alexandria Real Estate Inc (ARE)

PostPosted: Fri Mar 20, 2009 12:14 am
by iam802
for sure, that spike does screw up my chart...maybe that is their tatics.

screw the traders...while they some major shareholders sell off.

Re: Alexandria Real Estate Inc (ARE)

PostPosted: Fri Mar 20, 2009 12:32 am
by blid2def
Haha... IB shows the day high is 107.90 :D

Re: Alexandria Real Estate Inc (ARE)

PostPosted: Fri Mar 20, 2009 6:48 pm
by iam802
Look at the volume being sold off yesterday.

Almost 3 times the volume when it rebounds. This is going to be a good short candidate.

http://stockcharts.com/h-sc/ui?s=ARE&p= ... 5607411181

Re: Alexandria Real Estate Inc (ARE)

PostPosted: Wed Apr 22, 2009 12:12 am
by iam802
Dividend cut!

I don't have the offical source.

But, from this blog, it is pretty clear, that those who buy into it during this rally will be screwed.

Please visit the site to read it as it is a fairly long article.

http://www.stripnomics.com/alexandria-r ... fering/931

Re: Alexandria Real Estate Inc (ARE)

PostPosted: Fri May 22, 2009 12:07 pm
by iam802
My MACD readings is a bit rusty. So, take it with a pinch of salt.

The following chart uses 2 indicators to determine a short entry.

1. 20 day MA

2. MACD histogram

Image

Some points to note:

1. ARE has been trading at a lower range. Look at the boxes drawn. It is still not clear if the new range is between $31 and $35.

2. Yesterday, closing provides a clearer picture that it is now being resisted by the 20day MA. In fact, if I recall, yesterday ARE was ‘up’ till the later hours of the day. Perhaps, a sign that the bulls are getting exhausted.

3. MACD. A possible MACD bearish cross. I also counted 4 consecutive green MACD histogram. If a red histogram appears, that is my signal to short. (4green histogram followed by a 1 red histogram)

Re: Alexandria Real Estate Inc (ARE)

PostPosted: Wed Sep 30, 2009 12:08 pm
by iam802
Watch the volume and the kumo resistance

==
It’s been quite some time since my last ARE trade; a trade that I cut-loss.

I am not sure what caught my eyes today. Subconsciously, my mind was telling me to take a look at ARE again.

An interesting development on the Ichimoku charts.

On the Weekly Chart, I can see that ARE has hit the kumo’s wall; a very thick wall and a representation that resistance is strong moving forward. And with that it turns.

While it is normal for price to fluctuate and trade within range, what caught my eyes were the price action on the Daily Chart.

On the Daily Chart, we can see that there is some kind of sell off on September 24 which results in the price gapping down on opening. This year alone, there are 5 such sell offs (with volume more than 4.7M).
    March 19
    March 20
    April 21
    April 22
    Sept 24
From a technical analysis point of view, we can deduce the following:
    The current uptrend has been broken
    We may see a period of price consolidation
    It is still too early to say if the downtrend has started
    Ichimoku Weekly Chart suggest heavy resistance and price is entering the Weekly kumo (a period of trendless state)

Image

Image